
What are the most harmful forms of gambling?

What are the most harmful forms of gambling? Analyzing problem gambling prevalence surveys. CEFOS Working Paper 12. 2011. Per Binde. CEFOS (Centrum för forskning om offentlig sektor – Center for Public Sector Research ).
Abstract : What are the most harmful forms of gambling? Analyzing problem gambling prevalence surveys
Eighteen national prevalence surveys of problem gambling (PG), most of them from Europe, were analyzed to assess the relative harmfulness of various forms of gambling. It was found that interactive Internet gambling, casino gambling, electronic gaming machines, and high-stakes unregulated/illegal gambling are often relatively closely associated with PG, while lotteries and instant lotteries appear relatively harmless. Other forms of gambling—sports pools, bingo, horse betting, and sports betting—are typically relatively moderately associated with PG. This paper discusses the possibilities and limitations of assessing the harmfulness of various forms of gambling by analyzing prevalence survey data. It is concluded that although such analyses yield valuable insights, they should be complemented by other sources of information, such as statistics on the gambling activities of those seeking help for PG and qualitative studies of problem gambling.
Keywords
Problem gambling, prevalence, EGMs, casino, internet gambling, regulation
Introduction : What are the most harmful forms of gambling?
Problem gambling (PG) is a public health issue receiving increasing attention in many countries. In Western societies, approximately 0.5–1.0% of the adult population typically have serious gambling problems and an additional 1.5–2.0% have milder problems (Griffiths, 2009; Stucki & Rihs-Middel, 2007). Public authorities and responsible gambling companies wish to minimize the social, economic and health-related harms caused by PG.
It is generally acknowledged that certain types of gambling are more harmful and risky than others. With the term “harmful” is here meant gambling that “... is characterized by difficulties in limiting time and/or money spent on gambling which leads to adverse consequences for the gambler, other, or for the community” (Gambling Research Australia, 2005); with “risky” is meant gambling with a relatively high risk to produce harm. Traditional lotteries, for example, are often considered rather harmless, while electronic gaming machines (EGMs) in many contexts and jurisdictions are perceived as closely associated with PG (e.g. Afifi, et al. 2010; Griffiths, 2009; Lund, 2006; Productivity Commission, 2010; Turner & Ferentzy, 2010; Young & Stevens, 2009). Relative harmfulness, however, seems to vary depending on the mix of games offered on particular gambling markets and across consumer segments (Welte, et al., 2009). A few statistical analyses of population studies suggest, however, that the number of games played is a more important factor in problem gambling than the types of games played (LaPlante, et al., 2009; Welte, 2009).
Knowledge of the relative harmfulness of various forms of gambling will help regulators and responsible gambling companies optimize their efforts to counteract PG. Such knowledge may be obtained in various ways; this paper will discuss the possibility of assessing the relative harmfulness of various forms of gambling by analyzing data from prevalence studies of gambling participation and problem gambling. The paper will present an analysis of data from eighteen prevalence studies, most of them European.
The analysis of prevalence studies was conducted in the spring of 2008 as an assignment of the Commission of Inquiry into Gambling Policy, set up by the Swedish government in 2007, which draw up a model for future gambling policy and legislation. The main results of the analysis are presented in a section of the final report of the Commission (SOU, 2008a, 4.7.2). A full research report in Swedish presents the results more extensively and discusses methodological issues (Binde, 2009a). This paper represents a summary of the research report with updated references to studies into this area.
Few previous studies have compared prevalence surveys with a focus on the riskiness of various forms of gambling (for an overview, see Welte, et al., 2009). To the best of our knowledge, this exploratory study is the first to make an international comparison. It is hoped that this paper will be useful to researchers, authorities, and gambling companies interested in assessing the relative harmfulness of various forms of gambling.
How to assess the relative harmfulness of various forms of gambling
Most gambling scholars and others knowledgeable about gambling issues agree that some forms of gambling are more harmful than others. This opinion is based mainly on observations of the following kinds:
- Experiences of problem gamblers or people working in the gambling sector
- Statistics on the forms of gambling practiced by those who seek help for PG
- Studies of gambling behavior and cognitions across various forms of gambling
- Qualitative studies of PG
- Statistics from studies of prevalence of gambling and PG among the general population or a part thereof
The analysis in this paper concerns the last of these fields of observation. As will be explained in detail later, all prevalence surveys examined in this study indicate that there is a relatively strong association between some forms of gambling and PG, suggesting that these forms are relatively harmful and that the risk of their players developing gambling problems is relatively high.
Selected prevalence studies
The present analysis is based on tables and other numerical data contained in reports presenting PG prevalence surveys. The analyzed surveys fulfill the following two criteria:
- Survey a random sample of the general adult population
- Provide usable information on the association between various forms of gambling and PG
The study included all European PG surveys found to fulfill the criteria (a recent review of European research indicates that a few more surveys might have met the inclusion criteria, see Griffiths, 2009). As a complement and for comparison, five major studies from other countries in the Western world were also included. This selection of prevalence surveys, focusing on European data, was occasioned by the purpose of the study, namely, to help shape a new Swedish gambling policy.
Prevalence surveys were located using literature reviews (National Research Council, 1999; Shaffer & Hall, 1999; Stucki & Rihs-Middel, 2007; Volberg, 2004) and through the author’s contacts with colleagues. The following eighteen surveys were included:
- Thirteen European surveys from seven countries: from Denmark (Bonke & Borregaard, 2006), Finland (Aho & Turja, 2007; Ilkas & Turja, 2003), Iceland (Ólason et al., 2006), the Netherlands (de Bruin et al., 2005), Norway (Kavli, 2007; Kavli & Berntsen, 2005; Lund & Nordlund, 2003; Øren & Bakken, 2007), Sweden (Rönnberg et al., 1999; Westfelt, 2003), and the UK (Sproston et al., 2000; Wardle et al., 2007)
- The survey with the most respondents conducted in Australia (Productivity Commission, 1999)
- The largest survey in New Zealand (Abbott & Volberg, 2000)
- The largest survey in Canada (Wiebe et al., 2006)
- The two at the time most recent surveys in the USA, one of which is the largest conducted in that country (Volberg & Bernhard, 2006; Volberg et al., 2006)
The total number of respondents in the eighteen studies is 102,449. Details on the number of respondents in each study, survey method (telephone or mail), the response rate and the PG-instruments used are given in the Appendix of the full report, which is available via the internet (Binde, 2009a).
One of the Swedish surveys is not national in coverage, but has a large and fairly representative sample, i.e., more than 6,000 individuals in three Swedish cities. Since the present study was to guide Swedish gambling policy, an exception was made and West-felt (2003) was included to cast further light on the gambling activities of Swedes.
In addition to cross-sectional surveys, longitudinal studies were also scrutinized. Only three such studies fulfilling the selection criteria were found worldwide (Abbott et al., 1999; Westfelt, 2006; Wiebe et al., 2003). Although longitudinal studies potentially are of great value for understanding the variation of gambling problems over time on an individual level, the results of these three studies concerning the riskiness of various forms of gambling were, when compared, difficult to interpret and raised more questions than providing answers (Binde, 2009a). They will not be discussed here, and in the following we limit ourselves to cross-sectional surveys.
Information on forms of gambling in prevalence surveys
Instruments for measuring the prevalence of problem gambling in the general population, such as the South Oaks Gambling Screen (SOGS) (Lesieur & Blume, 1987) and the Canadian Problem Gambling Index (CPGI) (Ferris & Wynne, 2001), yield no information about specific forms of gambling. However, prevalence surveys usually also include queries about gambling participation and involvement. By combining PG scores and information on gambling habits on an individual level, the relationship between PG and various forms of gambling can be inferred; such inference can be more or less reliable.
A population sample must include enough problem gamblers to make an examination of their forms of gambling meaningful. An example of a survey excluded from this study because it examined too few problem gamblers is the Norwegian survey conducted by Götestam and Johansson (2003). Of its sample of 2014 people, only eleven were identified as having a gambling problem, scoring three or more on a DSM-IV-based instrument (APA, 1994). It would seem unwise to draw any conclusions regarding the harmfulness of various forms of gambling based on the activities of these eleven people.
Some reports of PG prevalence surveys contain information only about the gambling activities of problem gamblers over the past year or some other period. Such information says little about the relationship between PG and various forms of gambling, since problem gamblers often participate in many forms of gambling, not only in the form or forms that cause them problems. For example, they participate in lotteries to about the same extent as do average consumers of gambling products. Based on such information, some studies have presented counterintuitive results, for example, that lotteries should be considered a particularly harmful form of gambling (e.g., Johansson & Götestam, 2003). The gambling preferences and activities of problem gamblers should be compared with those of non-problem gamblers in order to observe reliable associations between PG and specific forms of gambling.
Population surveys may determine preferences by asking respondents about their subjective perception of playing, for example, what form of gambling the respondent “prefers” (Rönnberg et al., 1999), what is his or her “favorite” form (Lund & Nordlund, 2003), or “which is the gambling activity that you most enjoy?” (Abbott & Volberg, 2000, pp. 165, 252). A problem with such questions is that a problem gambler may not necessarily prefer the gambling activity that causes him or her the most harm (Productivity Commission, 1999, P9). Perhaps another form of gambling—which is unproblematic and social—is his or her favorite and the one that is most enjoyed. We do not know how people think when answering such questions, so data on forms of gambling and PG based on such queries are relatively unreliable.
This study identified two types of information usable for comparative purposes in the prevalence surveys on the relationship between various forms of gambling and PG:
- Participation information (PaI)
- Prevalence information (PrI)
PaI indicates how common it is for problem gamblers to participate in various forms of gambling versus how common these forms are among non-problem gamblers. In all the surveys included, PaI reveals that participation in some forms is much higher among problem gamblers than among non-problem gamblers, in some other forms slightly higher, and in still other forms about equal or even lower.
For example, the 1999 Swedish prevalence survey (Rönnberg et al., 1999) indicates that 8.6% of problem gamblers had participated in restaurant casino (typically a few low-stakes roulette and Black Jack tables in a licensed restaurant) gambling in the past week compared with only 0.8% of non-problem gamblers. The participation ratio between the two kinds of gamblers is 10.8, i.e., it was nearly eleven times more common for problem gamblers to participate than it was for non-problem gamblers. As to football pools, 32.1% of problem gamblers had participated in the past week compared with 13.3% of those without a gambling problem. The participation ratio between the two groups is 2.4; hence, it was more than twice as common for problem gamblers to participate as it was for gamblers without a problem. There was no significant difference between the two groups in terms of participation in lotteries. It may thus be concluded, regarding these three types of gambling activities in this survey, that restaurant casino gambling is relatively closely associated with PG, that football pools are relatively weakly associated, and that lotteries are not measurably associated.
The shorter the time interval of participation queried in a prevalence study, in general, the more pronounced the differences in gambling activities between problem and non-problem gamblers. PaI based on past week participation typically indicates greater differences than does PaI based on the past month, past year, or lifetime. The shorter the time interval, the better PaI reflects actual gambling involvement. For example, PaI on whether or not a person has used EGMs at least once in a lifetime says little about the person’s involvement in that game—most of the Swedish population has played EGMs at least once in their life (Rönnberg et al., 1999, p. 25). The information that a person has used EGMs in the past month or week tells us much more about involvement in that form of gambling and usually reveals significant differences between problem and non-problem gamblers.
In some studies (e.g., Lund & Nordlund, 2003, p. 76), PaI is presented as the number of gambling episodes within a certain period. This appears to be the kind of PaI that most accurately represents the actual intensity of gambling involvement. For example, the information that an individual has played bingo fourteen times in the past month is a much more precise indication of gambling involvement than the information that he or she has participated at least once in the past month. If all reports on prevalence studies included such information, analysis of associations between types of gambling and PG would be facilitated (c.f. Vaughan Williams et al., 2008).
Information on prevalence (PrI) indicates how many of those participating in a certain form of gambling within a given time period are problem gamblers and non-problem gamblers. Statistical raw data from a population survey may be presented as either PaI or PrI. There seem to be no particular advantages or disadvantages to the two types of information vis-à-vis each other. An example of PrI data may again be taken from the 1999 Swedish prevalence survey (see Table 1). It indicated that 8.5% of those who had played restaurant casino games in the past year were problem gamblers; the corresponding figure for football pools was 4% and for national lotteries 2.6%. Thus, these figures again indicate a relatively close association between restaurant casino games and PG and a relatively weak association for football pools. Since 2.1% of all past year gamblers were problem gamblers, national lotteries are not or very weakly associated with PG.
Information on gambling expenditure was included in the discussions of the full report but did not contribute much to the comparative analysis and is therefore left out here. The reliability of such information varies, since it is difficult in population surveys to make people accurately and consistently provide information on their past gambling expenses (Blaszczynski et al., 1997; Blaszczynski et al., 2006; Volberg et al., 2001). One problem is respondents mixing up net and gross expenditure—the difference between these is significant. In some types of gambling, it is also difficult for people to keep track of their bets, losses, and wins, for example, in EGM and casino games where wins are rapidly recycled as bets. Furthermore, winnings are often easier to recall than losses, which together with wishful thinking leads to the known tendency of gamblers to overestimate their wins and underestimate their losses (Gilovich, 1983).
PG is associated with playing a greater number of different games than the average (e.g. LaPlante, et al., 2009; Lund, 2006, Welte, et al., 2009). This aspect of PG is not covered by this study, which focuses on the question of what specific forms of gambling that are more or less harmful. The common experience of treatment providers and researchers doing qualitative studies of problem gamblers (including the present author) is that on average they indeed participate in more forms of gambling than non-problem gamblers, but that in the majority of cases problems are caused mainly by the excessive engagement in one single form of gambling.
Analysis of data and main results
All data tables that presented PaI and PrI were extracted from the eighteen prevalence survey reports. A few reports present PaI on the basis on different time intervals; if the number of gambling forms were similar, the table based on the longest time interval (and hence containing less reliable information) was discarded. Twenty-five tables remained and were entered into an MS Excel spreadsheet to facilitate inspection, comparison, and further calculations. PaI was complemented by the ratio between the percentage of gamblers with and without a gambling problem, if such a ratio had not already been calculated and was part of the original table. In a few tables presenting three categories of gamblers—i.e., non-problem, at-risk, and problem gamblers—the last two categories were merged into a combined risk/problem category. To increase the readability of the tables, all were sorted so that the form of gambling associated with the highest rate of PG (PrI) and the highest ratio of problem versus non-problem gambler participation (PaI) appeared on the top row, the other forms following below in descending order. The higher up in a table a form of gambling appeared, the stronger its relative association with PG. An illustrative example is provided in Table 1 (for the full set of tables, see Binde, 2009a, Appendix). A relative value on a nine point scale was also calculated, see below.
Table 1. Illustrative example of a data table. |
|
| |
Game | Category | SOGS 3+ (%) | Relative value |
Card games | Unregulated | 8.9 | 10 |
Restaurant casinos | Casino | 8.5 | 9.48 |
Slot machines | EGMs | 5.3 | 5.30 |
Bingo | Bingo | 5.3 | 5.30 |
Football pools | Sports pools | 4.0 | 3.61 |
Horse races | Horse betting | 4.0 | 3.61 |
Fast lotteries | Instant lotteries | 2.7 | 1.91 |
National lotteries | Lotteries | 2.6 | 1.78 |
Bingo-Lotto | Lotteries | 2.3 | 1.39 |
Local lotteries | Lotteries | 2.0 | 1 |
Current problem gambling prevalence (SOGS3+) by type of gambling in the past year, percent, and relative value on a nine point scale. Data from Swedish prevalence study, Rönnberg, et al. (1999).
The forms of gambling appearing in the tables from the prevalence surveys were often well-known categories, such as EGMs, bingo, and sports betting. Other forms of gambling were specific to particular countries. To facilitate comparison across surveys, these forms were labeled with the general category to which the games belonged and the information in the tables was complemented by these categories. In most cases, this was unproblematic. The categories used were the following:
- Bingo—bingo in a bingo parlor
- Casino—in some studies, casino gambling includes slot machines and EGMs in casinos, sometimes these are excluded
- EGMs—includes traditional slot machines and all other devices that resemble slot machines
- Horse betting—includes betting on dog races
- Instant lotteries
- Internet gambling—all kinds of Internet gambling; data in the studies appear primarily to concern Internet poker, casino, and sports betting
- Lotteries—national and local lotteries; lotto, keno, and other number games
- Sports pools—usually football pools; in some studies, football pools are included in sports betting
- Sports betting—some studies include sports pools in sports betting, while others list sports pools separately
- Unregulated gambling—this broad category includes card games and betting with friends, illegal gambling at clubs, and betting with non-licensed bookmakers, as well as all other gambling, legal or illegal, in private and without the supervision of authorities
It is unfortunate that unregulated gambling is such a broad category but this is the effect of prevalence studies often including, beside the widespread forms of gambling, vague residual categories such as “card games”, “private card and craps games”, “private betting”, and “private games”.
The 25 tables were then visually inspected, yielding the following clear impression: four categories of gambling were often relatively strongly associated with PG, i.e., Internet gambling, EGMs, casino gambling, and unregulated gambling; four forms of gambling were often moderately strongly associated with PG, i.e., sports betting, horse betting, bingo, and sports pools; and two categories of gambling were nearly always weakly associated with PG, i.e., instant lotteries and lotteries.
To verify the impression from this visual inspection of the tables, a method for numerically summarizing the information was developed. PaI ratios and PrI values in each table were converted to relative values on a nine-point scale, ranging from 1 for the category of gambling with the weakest association with PG to 10 for the strongest association. Intermediate values were calculated using a formula that transformed PaI and PrI values to their equivalents on the nine-point relative scale (see Table 1 and Figure 1).
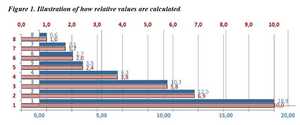
Percentages (blue/dark bars) of problem gamblers participating in various forms of gambling (1-8 on the vertical axis) are converted into points (red/light bars) on the nine point relative scale between 1 and 10. Data is from Abbot’s & Volberg’s (2000, p. 148, 165) New Zealand prevalence study. The forms of gambling are: 1. Slot machines, not in casino; 2. Betting, horses or dogs; 3. Private betting; 4. Other lotteries or raffles; 5 Instant Kiwi; 6. TeleBingo; 7. Lotto; 8. Daily Keno.
The details and specific results of this statistical work, the merits, limitations, and complications of which could be discussed at length, are presented in the full research report (Binde, 2009a). The results of the calculations confirmed the impression gained from the visual inspection. EGM, casino, Internet, and unregulated gambling were always the four categories of gambling found to be most strongly associated with PG, lotteries and instant lotteries were always the two most weakly associated categories, and the other categories always fell between them. Within the top and intermediate layers (relatively strong and moderate association with PG, indicated by double horizontal lines in Table 2) the specific positions of forms of gambling varied, depending on the particular method of calculation used; at the lower layer lotteries were always more weakly associated with PG than instant lotteries.
Table 2. Relative values based on PrI, using eleven source tables from eleven prevalence studies.
Relative
Form of gambling value
Internet 6.5
Casino 6.5
EGMs 6.2
Unregulated gambling 5.8
Sports betting 4.7
Horse betting 4.4
Bingo 4.0
Sports pools 3.5
Instant lotteries 2.2
Lotteries 1.2
The higher the relative value, the closer the association between a form of gambling and PG.
Discussion of patterns and discrepancies in the data
This part of the paper will discuss patterns and discrepancies observed in the data from the PG surveys.
Internet Gambling
Eleven of the eighteen prevalence studies present data on Internet gambling. In six of these studies, Internet gambling is among the types of gambling most strongly related to PG. Only the Dutch study suggests a relatively weak association between Internet gambling and PG.
Unfortunately, few of the prevalence studies distinguish between different kinds of Internet gambling. There is reason to believe that some non-interactive kinds are relatively weakly associated with PG, such as paying for participation in weekly lotto and sports pools, while interactive forms, such as Internet poker and casino, are relatively strongly associated. A very high proportion of problem gamblers have been observed in studies of Internet poker players. For example, two separate studies concluded that about one quarter of Swedish internet poker players reported indications of risky or problematic gambling habits (SOU, 2008b; Tryggvesson, 2007).
Interactive Internet gambling is relatively strongly associated with PG presumably because such gambling combines many known risk factors, such as a short time between bet and outcome, high play continuity, and bet outcomes that often depend on both chance and skill (Griffiths et al., 2006; Ranade et al., 2006; Williams & Wood, 2007). Furthermore, the social control of such gambling is weak since it often takes place in private, availability is high (in the home and at all hours of the day), and the value of money is obscured by bets being made using electronic chips/credits.
EGMs
Data on electronic gaming machines, slot machines, and similar devices are found in most of the prevalence studies scrutinized and suggest that this form of gambling generally is strongly associated with PG. However, there are exceptions and these are interesting because they illustrate the limitations of assessing the harmfulness of various forms of gambling using data from population studies.
Both Finnish studies demonstrate that the prevalence of PG among those who had participated in EGM gambling in the past year is quite low, just a little higher than among lottery players. This could be interpreted as indicating that EGMs in Finland are relatively harmless, but this is not true. In fact, EGMs in Finland are closely associated with PG: 70% of calls to the national helpline for problem gamblers in 2005 concerned excessive EGM gambling (Peluuri, 2006). The reason for this association not being visible in the population data appears to be that Finnish problem EGM gamblers, in international comparison, are diluted by an unusually high number of gamblers without problems. Many Finns used EGMs in the past year, 51% according to one of the surveys (Ilkas & Turja, 2003) and 35% according to the other (Aho & Turja, 2007). Slot machines have long been a widespread and quite accepted form of entertainment in Finland (Maitilainen, 2009) and today EGMs are easily available, as they are found at supermarket entrances, in bars and cafés, and in other public places. In comparison, in Sweden, where EGMs are strictly regulated and their availability limited to selected licensed restaurants, only 6% of the population used them in the past year (Westfelt, 2006).
High availability causing high participation among the population also explains the apparently weak association between EGMs and PG found in one of the Norwegian surveys (Lund & Nordlund, 2003, p. 74). At the time of the survey, Norway was one of the countries with the most EGMs per capita (about one machine per 250 inhabitants), and past year (Lund & Nordlund, 2003, p. 47). It may be noted, however, that this Norwegian study distinguishes between ordinary EGMs and bingo machines. With the first kind of machine, 4.7% of past-year users had a gambling problem, which is a relatively small proportion, while 17.9% of those who played bingo machines had such problems, which is a relatively high proportion. These differences may be explained by the fact that bingo machines were only available in bingo parlors, where dedicated bingo players gather, while ordinary EGMs were available in many kinds of public spaces, such as food stores and bars. Another telling observation in the statistics from this study is that data on gambling episodes in the past year, as opposed to data on participating at least once in the past year, suggest that EGM play is the gambling activity closest associated with PG (Lund & Nordlund, 2003, p. 76). As mentioned, this way of presenting data on gambling activities and PG appears the most precise for assessing the harmfulness of various forms of gambling. That EGMs were at this time a very risky form of gambling in Norway is evidenced by the fact that 87% of those who called the national helpline for problem gamblers in 2004 had EGMs as their main problem (Hjelpelinja, 2005).
Similar circumstances of high availability and the consequent large number of ordinary gamblers playing a little once in a while may explain the relatively weak association indicated between PG and gambling machines at casinos in the Canadian study (Wiebe et al., 2006, p. 68) and between PG and EGMs in the Danish study (Bonke & Borregaard, 2006, p. 28). An analysis of Danish prevalence data, using logistic regressions, shows that the most important factor differentiating between at-risk gamblers and no-risk gamblers is the type of game played and that the most risky games are gambling machines, betting on horses, and card and casino games (Lyk-Jensen, 2010).
Unregulated gambling
Data on unregulated gambling are presented in ten of the eighteen prevalence studies. Half of them suggest that unregulated gambling is among the forms of gambling most closely associated with PG, while the other data suggest only a weak association. Unregulated gambling is the form of gambling for which the variation in this respect is greatest. This is not surprising since unregulated gambling, as defined here, includes a wide variety of activities from low-stakes betting with friends (common in the UK, for example) to playing high-stakes poker at illegal gambling clubs (which occurs in many countries). When unregulated gambling is closely associated with PG, it seems often to refer to activities of people with a great interest in gambling, who are not content with the selection on the ordinary gambling market and attracted by specialized, complex and sometimes semi-professional high-stakes gambling, even if it is illegal.
Casino
Data on casino gambling are presented in twelve of the eighteen studies. In eight of these, casino gambling is relatively closely associated with PG. However, in three of the studies the association appears to be relatively weak.
These studies are all North American: from California (Volberg et al., 2006, p. 63), New Mexico (Volberg & Bernhard, 2006, p. 38), and Ontario (Wiebe et al., 2006, p. 68). It should first be noted that the Californian study presents data on lifetime participation and PG. This way of presenting data tends to level out differences between ordinary and problem gamblers. The two studies from the USA demonstrate that PG is only marginally more common among those who have visited a casino than among those who have bought lottery tickets. This probably has to do with visiting casinos being quite a common leisure activity in these parts of the USA, where there are many “Indian casinos” operated by Native American tribes. Furthermore, California borders on Nevada, and it is quite common for Californians to take holiday trips to Nevada and visit casinos. American casinos have, compared with European ones, a liberal dress code and offer plenty of amusements in addition to gambling, such as shows, cheap buffets, and shopping malls. Casinos are thus easily accessible and do not demand much of their visitors. Not only hard-core gamblers visit casinos but also many ordinary citizens. Similar circumstances may explain the results of the Canadian study, in which casino gambling outside of Ontario was less closely related to PG than were most other forms of gambling.
Sports betting
In most of the studies, sports betting appears to be moderately closely associated with PG, with two striking exceptions. One is spread betting in the British 2007 survey (Wardle et al., 2007), which found that 9% of those who participated in spread betting in the past week had a gambling problem, versus only 1% of those who bought lottery tickets. This can be explained by spread betting being a sophisticated and high-risk form of gambling, attracting mostly those who are dissatisfied with ordinary betting and wish for greater complexity and chances of higher reward despite greater risk. The other striking exception is sports betting “with a bookie” in the Canadian study, which appears to be the most PG-associated gambling form of all. This information should be treated cautiously, however, because very few respondents reported participating in such gambling. Never-theless, making bets with a bookie, rather than participating in sports betting offered by big gambling companies, is a typical behavior of gamblers who identify themselves as hard-core punters.
Bingo
In general, bingo is moderately closely associated with PG. However, some exceptions are indicated by studies from Sweden and Norway. One of the Swedish studies (Westfelt, 2003, p. 17) demonstrates that 11% of problem gamblers played bingo in the past year, while only 2% of those without such problems played. This result may well reflect the reality at that time. Bingo is known in Sweden, through experiences from mutual support groups and counseling services for problem gamblers, to be a source of PG, especially among women. Two of the Norwegian studies also suggest that bingo is a relatively harmful form of gambling (Kavli & Berntsen, 2005, p. 33; Øren & Bakken, 2007, p. 32 and 36).
Sports pools
Data on sports pools are found in ten of the eighteen studies. All but one study found this form of gambling to be just moderately associated with PG, only slightly more strongly than instant lotteries and lotteries. The exception is the Icelandic study (Ólason et al., 2006), which demonstrated that 8.3% of those who entered football pools in the past year were problem gamblers, as were 10.7% of those who did so in the past month. This can be compared with entering the lotto, for which the corresponding figures being 2.1% and 2.7%. That football pools are more strongly associated with PG than in other countries in this comparative study can be explained by the meager offerings on the Icelandic gambling market. There are EGMs, football pools, some sports betting, bingo, a few lotteries, and private card games. It can be assumed that on such a limited market, gambling addicts, lacking variety in gambling forms that provide effective escape from dysphoric mood and/or strong sensations of excitement (see below), are also attracted by forms that give relatively mild stimuli.
Instant lotteries
Instant lotteries are even less associated with PG than are sports pools. There are, however, one possible exception in the data. One of the Norwegian studies (Kavli, 2007, p. 46) indicates that problem gamblers are almost eight times more likely than non-problem gamblers to have bought instant lottery tickets in the past week, making instant lotteries
almost as closely associated with PG as are EGMs. No explanation can be offered for this divergent result, and another Norwegian study (Kavli & Berntsen, 2005)—using the same definition of instant lotteries, the same PG screen, and weekly participation data—indi-cates only a relatively weak association between instant lotteries and PG.
Lotteries
Data on lotteries (including lotto, keno, and other number games) are offered by all eighteen prevalence studies. With few exceptions, lotteries are the form of gambling that is the weakest related to PG, and in no case is the association strong.
General discussion
A possible explanation of patterns and discrepancies
Data from prevalence studies thus indicate that some forms of gambling are more closely associated with PG than other forms, the proportion of problem gamblers being relatively high among participants in those forms. As a hypothesis, it may be suggested that three interacting factors account for that association: the emotional effect of the game, the requirements for play, and the integration of the game into the surrounding society.
Emotional effect. Gambling forms strongly associated with PG characteristically offer comparatively more escape and excitement, which problem gamblers seek when using gambling for emotional management (Jacobs, 1986; Ricketts & Macaskill, 2003; Wood & Griffiths, 2007). Furthermore, these forms of gambling permit rapid play and typically stimulate the gambler to continue playing. An illusion of often being close to winning is created in many games and chance events often appear similar to predictable events. These are factors known to intensify gambling involvement (Griffiths, 1993).
Requirements for play. Many kinds of gambling that are relatively strongly associated with PG also demand a great deal of the gambler. To visit an illegal gambling club, the visitor must feel comfortable supporting a criminal activity and accept the risks involved in being there. To visit a casino in Sweden, the participant must be 20 years or older, be registered at the entrance (after presenting one’s social security number and photo ID), conform to the dress code, and, if poker is to be played, have some knowledge of how to play. EGM play in Sweden entails visiting a licensed restaurant and not being bothered by the social stigma, habitual EGM playing commonly being regarded as an activity of socially marginalized people. Playing Internet poker requires a computer, high-speed Internet access, a credit card, and going through the registration process. Such things deter casual gamblers more than problem gamblers, who have a higher motivation to participate because of their need for escape and excitement. Furthermore, some problem gamblers make gambling their lifestyle, which makes them very committed to playing.
Integration into the surrounding society. Some forms of gambling that are relatively strongly associated with PG offer little besides the activity of gambling itself. For example, playing slot machines mainly consists of pushing the machine’s button and observing the display, while playing roulette essentially amounts to picking a number, watching the ball bounce along the rotating wheel, and becoming happy or displeased depending on where the ball finally comes to rest. Such forms of gambling make the casual gambler less motivated to participate than do forms also offering other experiences and that are integrated in various ways into the surrounding society. Entering football pools, for example, often reflects a great interest in football and may be done in the company of friends or colleagues at work; watching the football matches at the arena or on television is often the core of the experience, gambling serving only as an enhancement. Football teams are integrated into society in many ways, for example, through representing their town or country of domicile. Thus, non-problem gamblers are inclined to prefer gambling forms that offer something more than pure gambling, while problem gamblers tend to be content with or even prefer “hard-core” gambling forms. They often have elaborated thoughts about and strategies for simple games, such as EGMs and roulette, and make these games an important part of their life-world.
These three factors together seem to explain the general pattern of association found in the prevalence studies between various forms of gambling and PG. The emotional effect must be significant if the game is to be used for emotional management by problem gamblers, extensive requirements for play deter leisure gamblers more than problem gamblers from participating, and low integration into the surrounding society makes ordinary gamblers less motivated to participate while not deterring problem gamblers.
These factors typically interact. If a form of gambling is perceived as harmful, regulatory measures are usually taken to reduce harm. These measures typically restrict availability and add to the requirements for participation. This deters casual gamblers from playing, especially if the form of gambling is “hard core,” offering little more than gambling itself and related to little else in society. Those addicted to gambling, however, are not easily deterred as long as the game can effectively be used for emotional management. Exceptions to this general pattern are caused by the interaction between the factors being unusual or by peculiarities of a particular gambling market and its regulation.
However, this hypothesis about three characteristics of games accounting for their association with PG, as it appears in prevalence studies, needs to be elaborated. Excessive gambling may be driven by other reasons than the need for emotional management, for instance social factors or the idea to make money by playing games perceived to involve skill.
Widespread low-risk forms of gambling versus small high-risk forms
Suppose that 100,000 people regularly participate in gambling form X and that 10% of them, 10,000 people, have problems with that particular form. Suppose also that 1,000,000 people regularly participate in gambling form Y and that 2% of them have problems with that form. Gambling form X appears more risky and harmful than Y since five times as many of its players have problems with it (10% versus 2%, respectively). Gambling form Y, however, may appear to be a greater social problem than form X, since twice as many people (20,000 versus 10,000) have problems related to it.
Similar calculations could be made using the data from many prevalence studies. The problem, however, is that estimates of the number of people who have problems with major, popular forms of gambling tend to be inexact. This difficulty can be illustrated by figures from the British prevalence study from 2000 (Sproston et al., 2000, p. 59). Among those who entered the National Lottery, 1.2% had a gambling problem. However, among those who only entered the National Lottery and did not participate in any other form of gambling, only 0.1% had a gambling problem. Thus, of an adult population of 46 million, approximately 552,000 people possibly had a gambling problem relating to the National Lottery while 46,000 people probably had. It is thus not easy to determine just from prevalence survey data for how many people the National Lottery is a harmful form of gambling. Such data speak more clearly about the relative harmfulness of the National Lottery compared with other forms of gambling.
Prevalence surveys thus provide better insights into the relative harmfulness of various forms of gambling than into the absolute numbers of those harmed. To estimate that number, it might be preferable to make inferences from statistics on the gambling activities of those who seek help from PG help lines, clinics, and mutual support groups.
Conclusion
This exploratory scrutiny of PG prevalence surveys has several limitations. It presents a static analysis of dynamic phenomena. The relative harmfulness of various forms of gambling shifts constantly because of changes in the gaming market (e.g., introduction of new games), the implementation of responsible gambling measures by gambling companies, changes in gambling regulation, and processes of adaptation to the hazards of gambling among at-risk and problem gamblers.
Most of the prevalence surveys analyzed are from Europe, so caution should be exercised in generalizing the conclusions as to the relative harmfulness of various forms of gambling to other parts of the world. Gambling markets may differ and the social and cultural significance of various forms of gambling may vary, making certain games especially attractive to problem gamblers in particular cultures.
The analysis concerns prevalence studies of the past, four of which are from the 1990s. The general picture that emerges of the relative harmfulness of various forms of gambling may differ from the current state of affairs. Furthermore, a current association between a form of gambling and PG speaks more about past risks and present harmfulness than about current risks and possible harms in the future.
The comparative discussions presented here concern quite broad categories of gambling. Within these categories, specific forms of gambling may differ significantly in their harmfulness. As pointed out, this is certainly a problem with the broad category of Internet gambling.
Assessing relationships found in prevalence studies between various forms of gambling and PG entails numerous methodological problems, and possible misrepresentations of the examined studies have been repeated here.
Despite these limitations, this study suggests that interactive Internet gambling, EGMs, casino gambling, and high-stakes unregulated/illegal gambling are often relatively harmful forms of gambling. Instant lotteries and ordinary lotteries (including lotto and other number games) generally appear relatively harmless. Other forms of gambling— sports pools, bingo, horse betting, and sports betting—typically constitute an intermediate category that is moderately associated with PG. The results of this comparative study thus agree with much other research into PG.
The study shows that some prevalence surveys do not accurately indicate the harmfulness of specific forms of gambling (i.e. EGMs and casino gambling) that are widely available in the jurisdictions in question and in which therefore a comparatively large part of the population occasionally participate.
A methodological conclusion of the present analysis is that PG prevalence studies should be planned to provide as precise and accurate information as possible on the association between various forms of gambling and PG. The usefulness of such information increases with the precision of the data on gambling involvement. Relatively high precision seems to be offered by data on number of gambling episodes per month and per type of gambling.
In judging the harmfulness of particular forms of gambling in a specific jurisdiction, conjectures drawn from prevalence studies in that and similar jurisdictions should be complemented by information from other sources. Two such sources are statistics on the forms of gambling preferred by those who seek help for PG and qualitative studies of problem gambling. The reality check provided by such sources close to problem gamblers may reveal imperfections in quantitative analyses of prevalence data (Binde, 2009b).
Several pertinent questions remain unanswered and may be illuminated by further research. The hypothesis – that three characteristics of forms of gambling (emotional effect, requirements for play and integration into the surrounding society) together account for their association, as it appears in prevalence studies, with PG – need to be evaluated and refined. Do some forms of gambling more than others serve as gateways to PG? Does the harmfulness of various forms of gambling vary across demographic and social variables such as gender, age, and education? Longitudinal studies may answer the question if gambling problems related to some forms of gambling are more persistent than problems related to other forms. Do problem gamblers choose forms of gambling mostly on the grounds of their relative or absolute capacity to provide disassociation and excitement? Thus, if all relatively harmful forms of gambling were removed from the market, would problem gamblers switch to less harmful forms, which would then become the most harmful, leaving the prevalence of PG largely unchanged? Or, would many problem gamblers recover and PG prevalence drop significantly? The answers to these questions have important policy implications.
There is no question, however, that some people ruin their lives by excessive gambling and that this also has a negative impact on people around them and on society at large. A challenge for gambling studies is to identify the most harmful forms of gambling and what it is that makes them risky. With that knowledge, responsible gambling companies, policy makers, and regulators are better positioned to prevent gambling from causing harm and allow the leisure gambler to enrich his or her life with the joys, thrills, and companionship of play.
Acknowledgments
This study was financed by the Government Offices of Sweden.
References
Abbott, M.W., Williams, M.M., & Volberg, R.A. (1999). Seven Years On: A Follow-Up Study of Frequent and Problem Gamblers Living in the Community. Report Number Two of the New Zealand Gambling Survey. Wellington: The Department of Internal Affairs.
Abbott, M.W., & Volberg, R.A. (2000). Taking the Pulse on Gambling and Problem Gambling in New Zealand: A Report on Phase One of the 1999 National Prevalence Survey. Wellington: The Department of Internal Affairs.
Afifi, T.O., Cox, B.J., Martens, P.J., Sareen, J., & Enns, M.W. (2010). The relation between types and frequency of gambling activities and problem gambling among women in Canada. Canadian Journal of Psychiatry, 55, 21-28.
Aho, P., & Turja, T. (2007). Suomalaisten rahapelaaminen 2007. Helsinki: Sosiaali- ja terveysministeriö.
APA (1994). American Psychiatric Association: Diagnostic and Statistical Manual of Mental Disorders. Fourth Edition. Washington, DC: American Psychiatric Association.
Blaszczynski, A., Dumlao, V., & Lange, M. (1997). “How much do you spend gambling?” Ambiguities in survey questionnaire items. Journal of Gambling Studies, 13, 237-252.
Blaszczynski, A., Ladouceur, R., Goulet, A., & Savard, C. (2006). “How much do you spend gambling?”: Ambiguities in questionnaire items assessing expenditure. International Gambling Studies, 6, 123-128.
Binde, P. (2009a). Vilka är de mest riskfyllda spelformerna? En analys av befolknings-studier av spelproblem (CEFOS Rapport 2009:1). Göteborg: CEFOS. Accessed on December 15, 2010, at http://www.cefos.gu.se/digitalAssets/1269/1269415_cefosrapp2009-01.pdf
— (2009b). Gambling motivation and involvement: A review of social science research. (FHI R 2009:20.) Östersund: Statens folkhälsoinstitut.
Bonke, J., & Borregaard, K. (2006). Ludomani i Danmark: Udbredelsen af pengespil og problemspillere. København: Socialforskningsinstituttet.
de Bruin, D., Meijerman, C., Leenders, F., & Braam, R. (2005). Verslingerd aan meer dan een spel. Een onderzoek naar de aard en omvang van kansspelproblematiek in Nederland. Utrecht: WODC/CVO.
Ferris, J., & Wynne, H. (2001). The Canadian Problem Gambling Index: Final Report. Ottawa: Canadian Centre on Substance Abuse.
Gambling Research Australia. (2005). Problem Gambling and Harm: Towards a National Definition. Melbourne: Office of Gaming and Racing, Victorian Government, Department of Justice.
Gilovich, T. (1983). Biased evaluation and persistence in gambling. Journal of Personality and Social Psychology, 44, 1110-1126.
Griffiths, M. (1993). Fruit machine gambling: The importance of structural characteristics. Journal of Gambling Studies, 9, 101-120.
— (2009). Problem gambling in Europe: An overview. Nottingham: Nottingham Trent University. Accessed on December 15, 2010, at http://www.responsiblegambling.org/articles/Prob%20Gamb%20Europe%202009%2 0(3).pdf
Griffiths, M., Parke, A., Wood, R., & Parke, J. (2006). Internet gambling: An overview of psychosocial impacts. UNLV Gaming Research and Review Journal, 10, 27-39.
Götestam, K.G., & Johansson, A. (2003). Characteristics of gambling and problematic gambling in the Norwegian context: A DSM-IV-based telephone interview study. Addictive Behaviors, 28, 189-197.
Hjelpelinja (2005). Hjelpelinja for speleavhengige. Samtalestatistikk 2004. Oslo: Lotteri-og stiftelsestilsynet.
Ilkas, H., & Turja, T. (2003). Penningspelsundersökning. Helsinki: Social- och hälso-vårdsministeriet.
Jacobs, D.F. (1986). A general theory of addictions: A new theoretical model. Journal of Gambling Behavior, 2, 15-31.
Johansson, A., & Götestam, K.G. (2003). Gambling and problematic gambling with money among Norwegian youth (12-18 years). Nordic Journal of Psychiatry, 57, 317321.
Kavli, H. (2007). Spillevaner og spilleproblemer i den norske befolkningen: Analyserap-port 2007. Oslo: Synnovate MMI.
Kavli, H., & Berntsen, W. (2005). Undersokelse om pengespill: Spillevaner og spillepro-blemer i befolkningen. Oslo: MMI.
LaPlante, D., Nelson, S.E., LaBrie, R.A., & Shaffer, H.J. (2009). Disordered gambling, type of gambling and gambling involvement in the British Gambling Prevalence Survey 2007. The European Journal of Public Health (Advance Access, published November 5, 2009).
Lesieur, H.R., & Blume, S.B. (1987). The South Oaks Gambling Screen (SOGS): A new instrument for the identification of pathological gamblers. American Journal of Psychiatry, 144, 1184-1188.
Lund, I., & Nordlund, S. (2003). Pengespill og pengespillproblemer i Norge. Oslo: SIRUS.
Lund, I. (2006). Gambling and problem gambling in Norway: What part does the gambling machine play? Addiction Research & Theory, 14, 475-491.
Lyk-Jensen, S.V. (2010). New evidence from the grey area: Danish results for at-risk gambling. Journal of Gambling Studies 26: 455-467.
Maitilainen, R. (2009). A question of money? The founding of two Finnish gambling monopolies. In S. F. Kingma (Ed.), Global Gambling: Cultural Perspectives on Gambling Organizations (pp. 21-37). New York & London: Routledge.
National Research Council (1999). Pathological Gambling: A Critical Review. Washington, DC: National Academy Press.
Ólason, D.T., Grétarsson, S., J., & Smári, J. (2006). Prevalence of gambling participation and problem gambling among adults and adolescents in Iceland. Paper presented at the SNSUS seminar “Gambling in the Nordic Countries”, Helsinki, November 17, 2006.
Peluuri (2006). Peluuri hjälplinjens statistik 2005. Accessed on December 15, 2010, at
http://www.peluuri.fi/peluuri_hjalplinjen__/peluuri_hjalplinjens_statistik_2005/ Productivity Commission (1999). Australia’s Gambling Industries: Report No. 10. Can-
berra: AusInfo.
— (2010). Gambling. Report no. 50. Canberra: Productivity Commission.
Ranade, S., Bailey, S., & Harvey, A. (2006). A Literature Review and Survey of Statistical Sources on Remote Gambling. London: RSe Consulting.
Ricketts, T., & Macaskill, A. (2003). Gambling as emotion management: Developing a grounded theory of problem gambling. Addiction Research and Theory, 11, 383-400.
Rönnberg, S., Volberg, R.A., Abbott, M.W., Moore, W.L., Andrén, A., Munck, I., Jons-son, J., Nilsson, T., & Svensson, O. (1999). Gambling and Problem Gambling in Sweden. Stockholm: Statens folkhälsoinstitut.
Shaffer, H.J., & Hall, M.N. (1999). Estimating the prevalence of disordered gambling behavior in the United States and Canada: A research synthesis. American Journal of Public Health, 89, 1369-77.
SOU (2008a). En framtida spelreglering: Slutbetänkande av Spelutredningen. Statens offentliga utredningar, 2008:124.
— (2008b). Svenska Spels nätpoker: En utvärdering. Statens offentliga utredningar, 2008:36.
Sproston, K., Erens, B., & Orford, J. (2000). Gambling Behaviour in Britain: Results from the British Gambling Prevalence Survey. London: National Centre for Social Research.
Stucki, S., & Rihs-Middel, M. (2007). Prevalence of adult problem and pathological gambling between 2000 and 2005: An update. Journal of Gambling Studies, 23, 245257.
Tryggvesson, K. (2007). Nätpokerspelandet i Sverige: Omfattning, utveckling och ka-raktär 2006. (SoRAD Forskningsrapport nr. 43.) Stockholm: SoRAD.
Turner, N.E. & Ferentzy, P.L. (2010). The natural life history of a lottery: The importance of large wins in the establishment and survival of a lottery. International Gambling Studies 10: 19-30.
Wardle, H., Sproston, K., Orford, J., Erens, B., Griffiths, M., Constantine, R., & Pigott, S. (2007). British Gambling Prevalence Survey 2007. London: National Centre for Social Research.
Vaughan Williams, L., Page, L., Parke, J., & Rigbye, J. (2008). British gambling prevalence survey 2007: Secondary analysis. UK: Gambling Commission.
Welte, W. J. (2009). The addictiveness of specific gambling games. The Brief Addiction Science Information Source (BASIS). Accessed on December 15, 2010, at http://www.basisonline.org/2009/07/the-addictiveness-of-specific-gambling-games.html
Welte, J.W., Barnes, G.M., Tidwell, M.-C.O., & Hoffman, J.H. (2007). The association of form of gambling with problem gambling among American youth. Psychology of Addictive Behaviors, 23, 105-112.
Westfelt, L. (2003). Spelproblem i tre svenska orter: Resultat från 6000 intervjuer i Sundsvall, Malmö och Karlstad. SoRAD rapport 10. Stockholm: SoRAD
— (2006). Två studier om spel och spelproblem: En tvärsnittsanalys och en longitudinell analys om risken för spelproblem. SoRAD rapport 34. Stockholm: SoRAD.
Wiebe, J., Cox, B., & Falkowski-Ham, A. (2003). Psychological and Social Factors Associated with Problem Gambling in Ontario: A One Year Follow-Up Study. Ontario: Responsible Gambling Council.
Wiebe, J., Mun, P., & Kauffman, N. (2006). Gambling and Problem Gambling in Ontario 2005. Ontario: Responsible Gambling Council.
Williams, R.J., & Wood, R.T. (2007). Internet Gambling: A Comprehensive Review and Synthesis of the Literature. Report prepared for the Ontario Problem Gambling Research Centre, Guelph, Ontario, Canada. Aug 30, 2007.
Volberg, R.A. (2004). Fifteen years of problem gambling prevalence research: What do we know? Where do we go? Electronic Journal of Gambling Issues: eGambling, 10.
Volberg, R.A., & Bernhard, B. (2006). The 2006 Study of Gambling and Problem Gambling in New Mexico: Report to the Responsible Gaming Association of New Mexico. Northampton, MA: Gemini Research.
Volberg, R.A., Gerstein, D.R., Christiansen, E.M., & Baldridge, J. (2001). Assessing self-
reported expenditures on gambling. Managerial and Decision Economics, 22, 77-96. Volberg, R.A., Nysse-Carris, K.L., & Gerstein, D.R. (2006). 2006 California Problem
Gambling Prevalence Survey (Final Report). Chicago: NORC.
Wood, R.T.A., & Griffiths, M.D. (2007). A qualitative investigation of problem gambling as an escape-based coping strategy. Psychology and Psychotherapy: Theory, Research and Practice, 80, 107-125.
Young, M. & Stevens, M. (2009). Player preferences and social harm: An analysis of the relationships between player characteristics, gambling modes, and problem gambling. International Journal of Mental Health and Addiction 7: 262-279.
Øren, A., & Bakken, I.J. (2007). Pengespill og pengespillproblemer i Norge 2007. Oslo: SINTEF Helse.